Load Tests
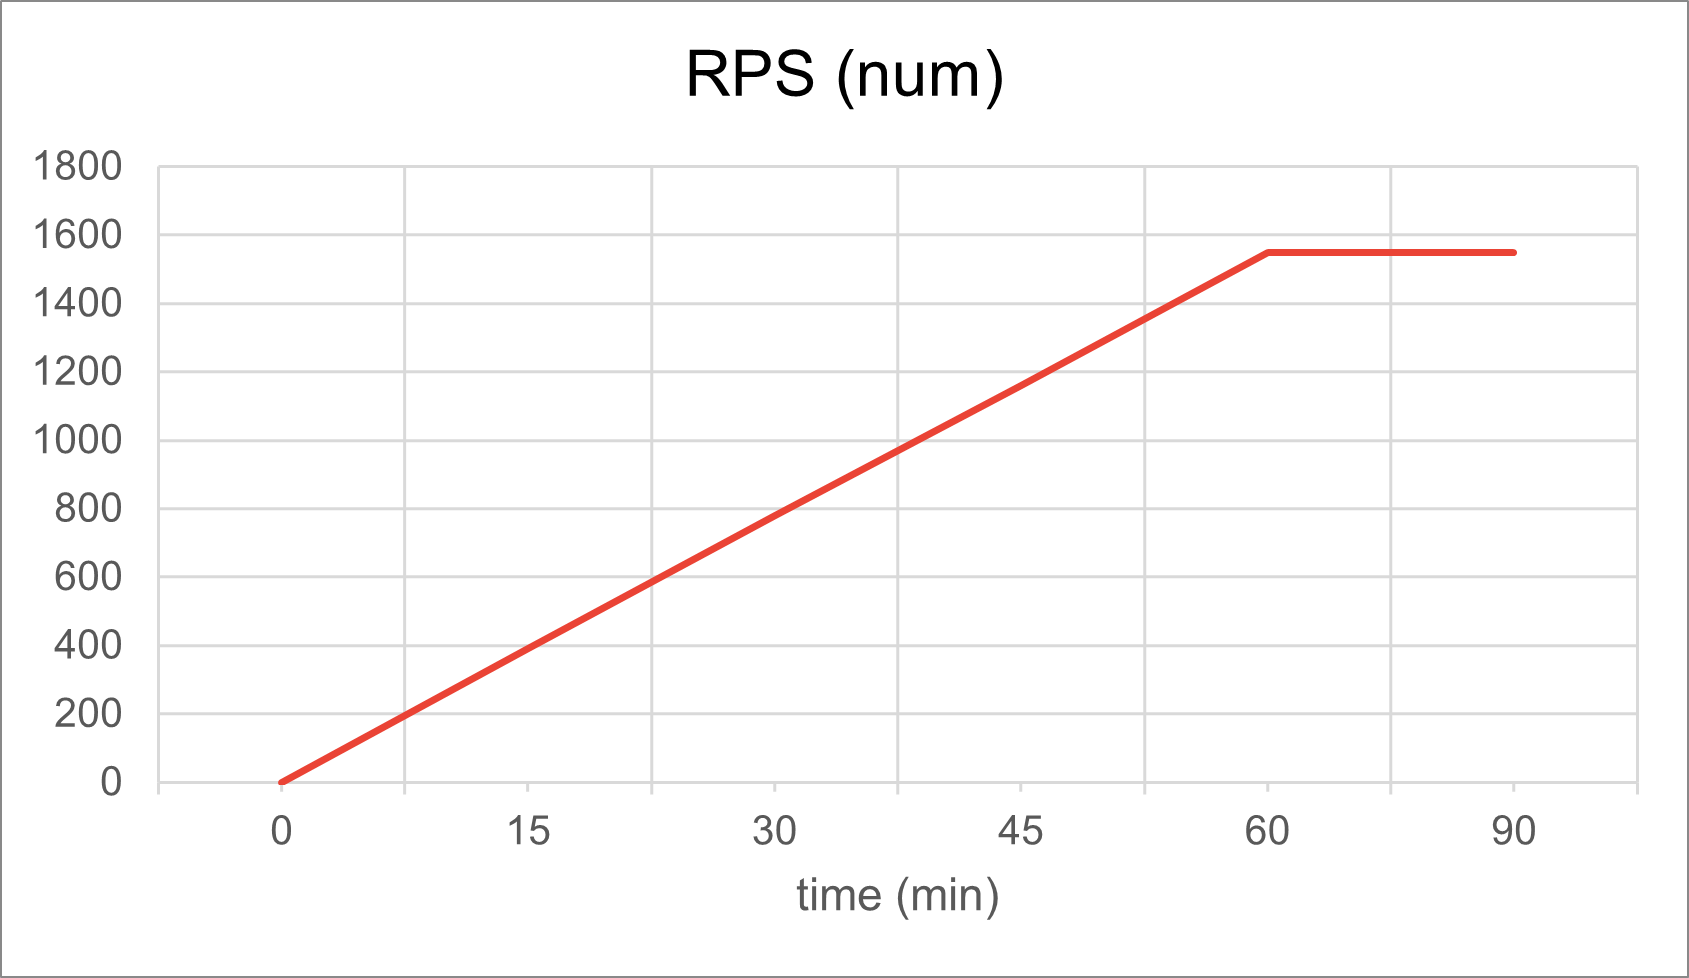
Load tests apply sustained, realistic traffic to a healthy cluster and measure how StornX behaves over time on the four axes that matter: latency, cost, replica count, resource use.
Two workloads were exercised - the same on both: Online Boutique and the OpenTelemetry Demo.
Online Boutique under load
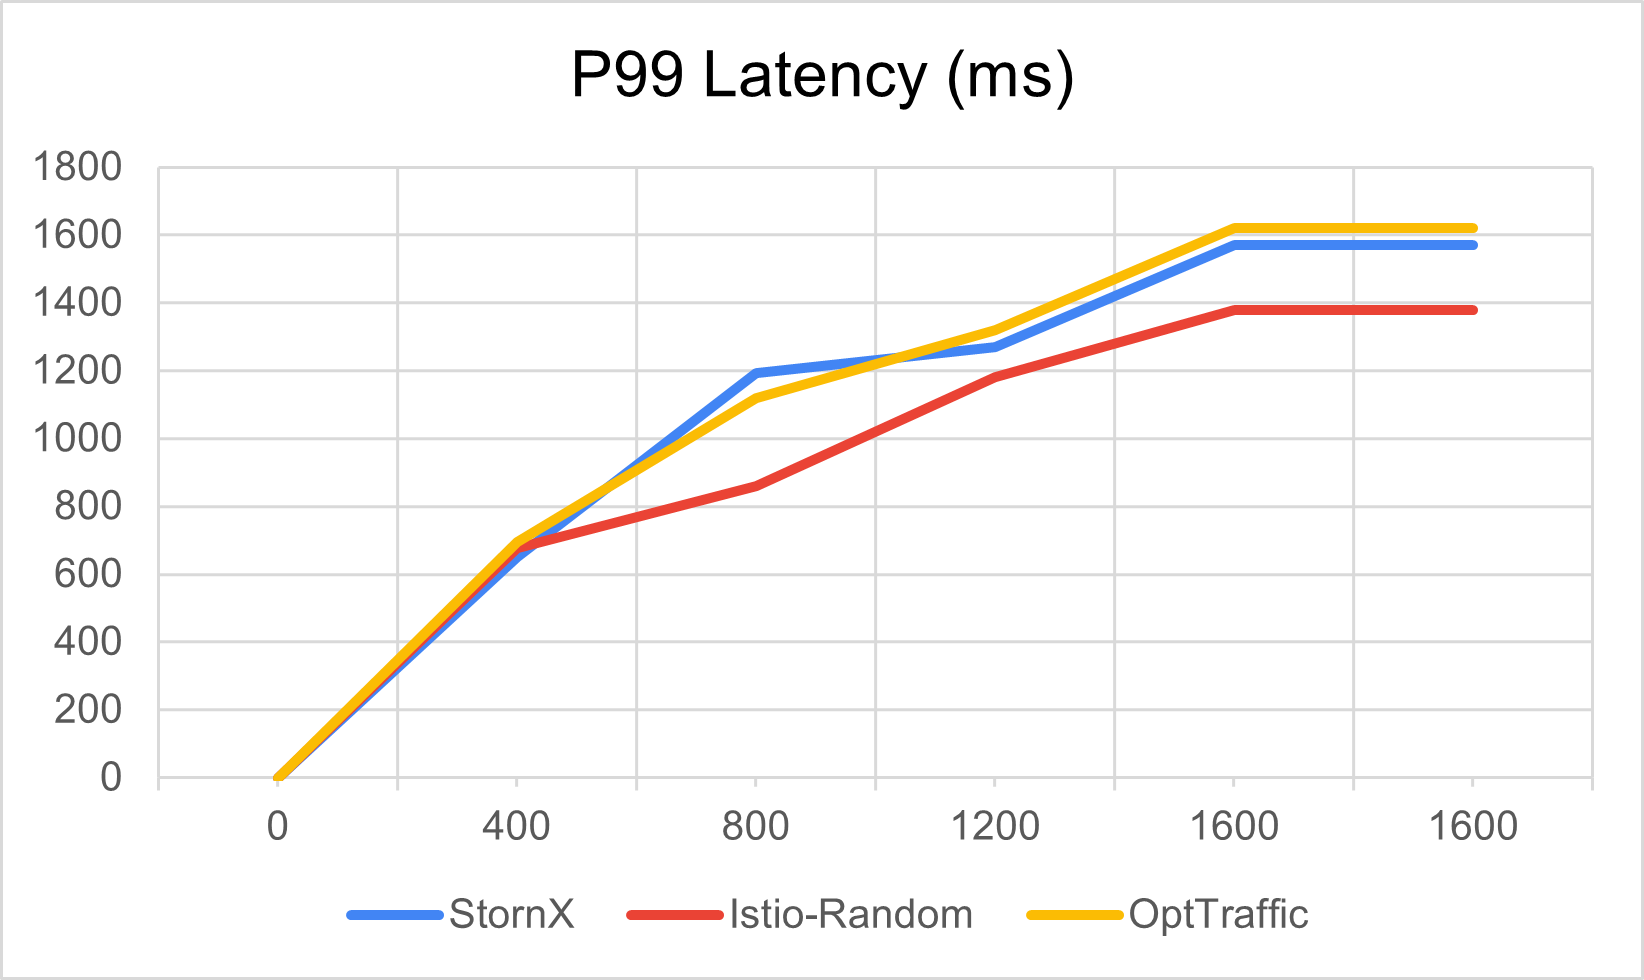
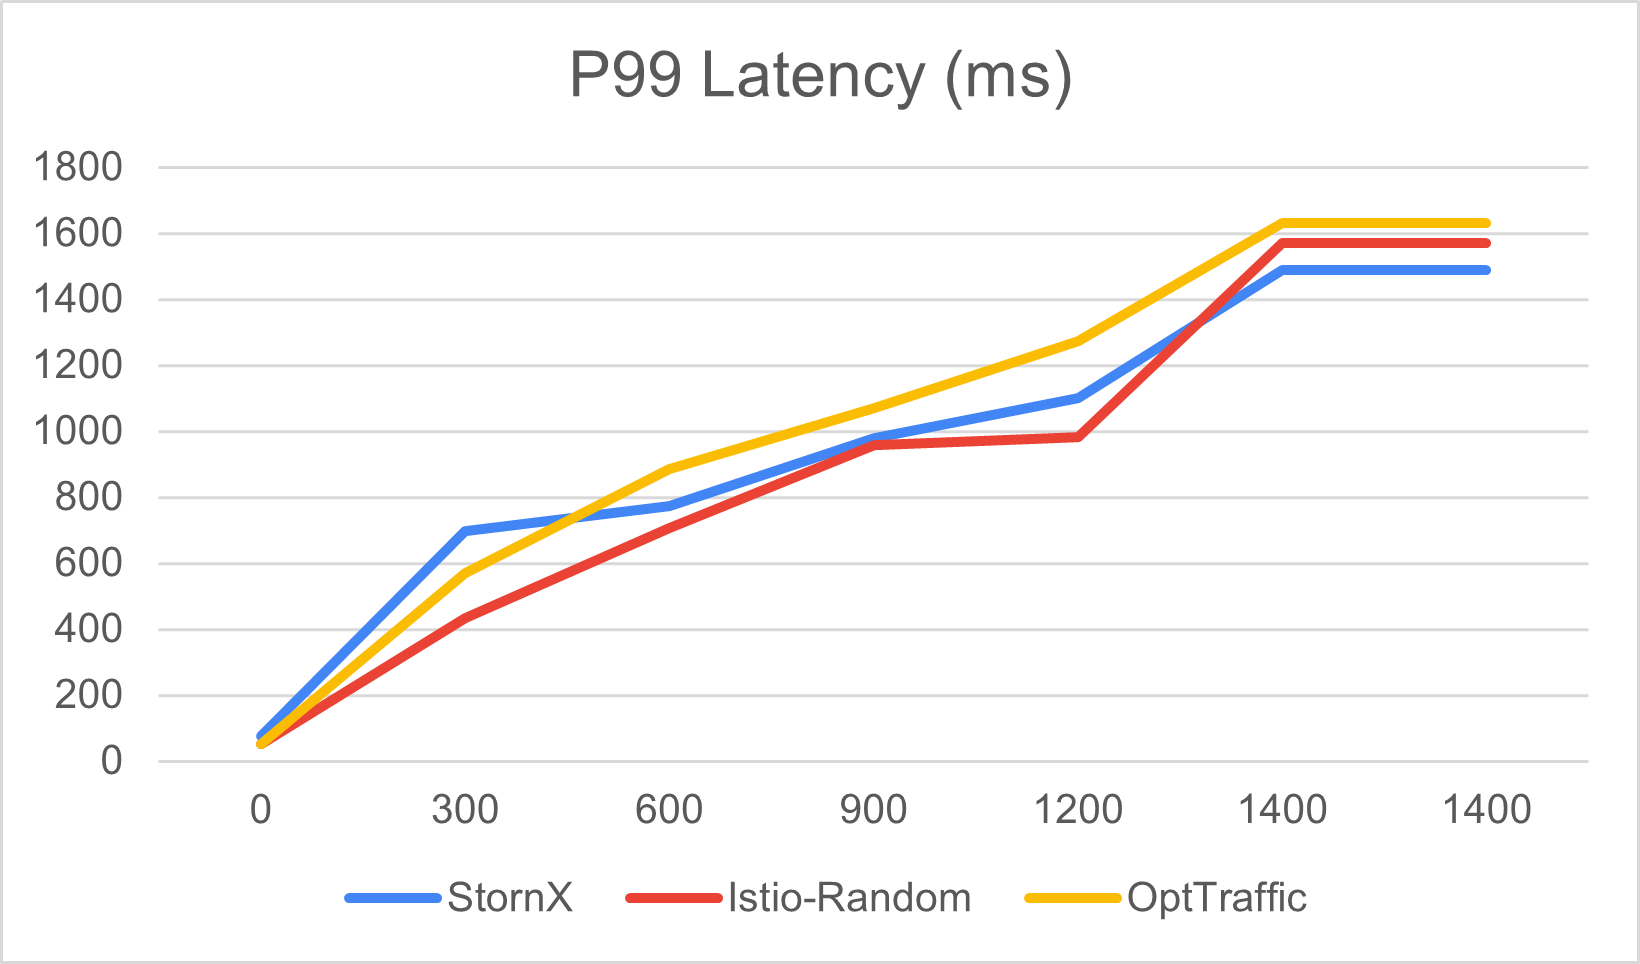
End-to-end latency drops with StornX once the controller has had a few cycles to re-place replicas toward their busiest neighbours:
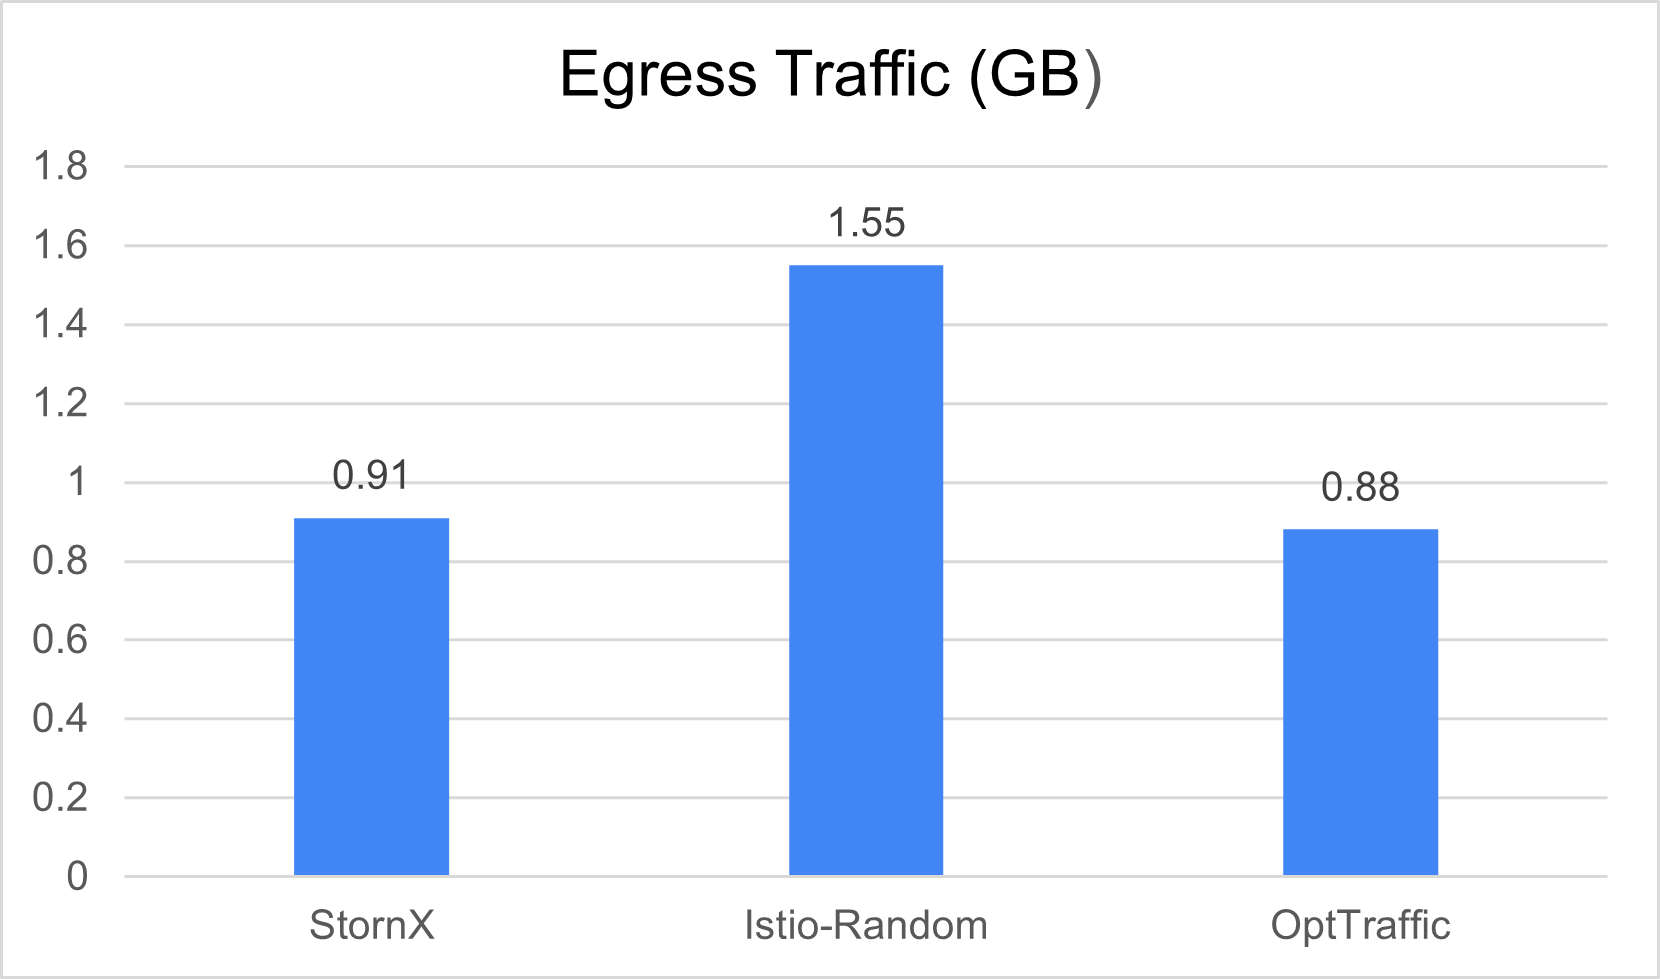
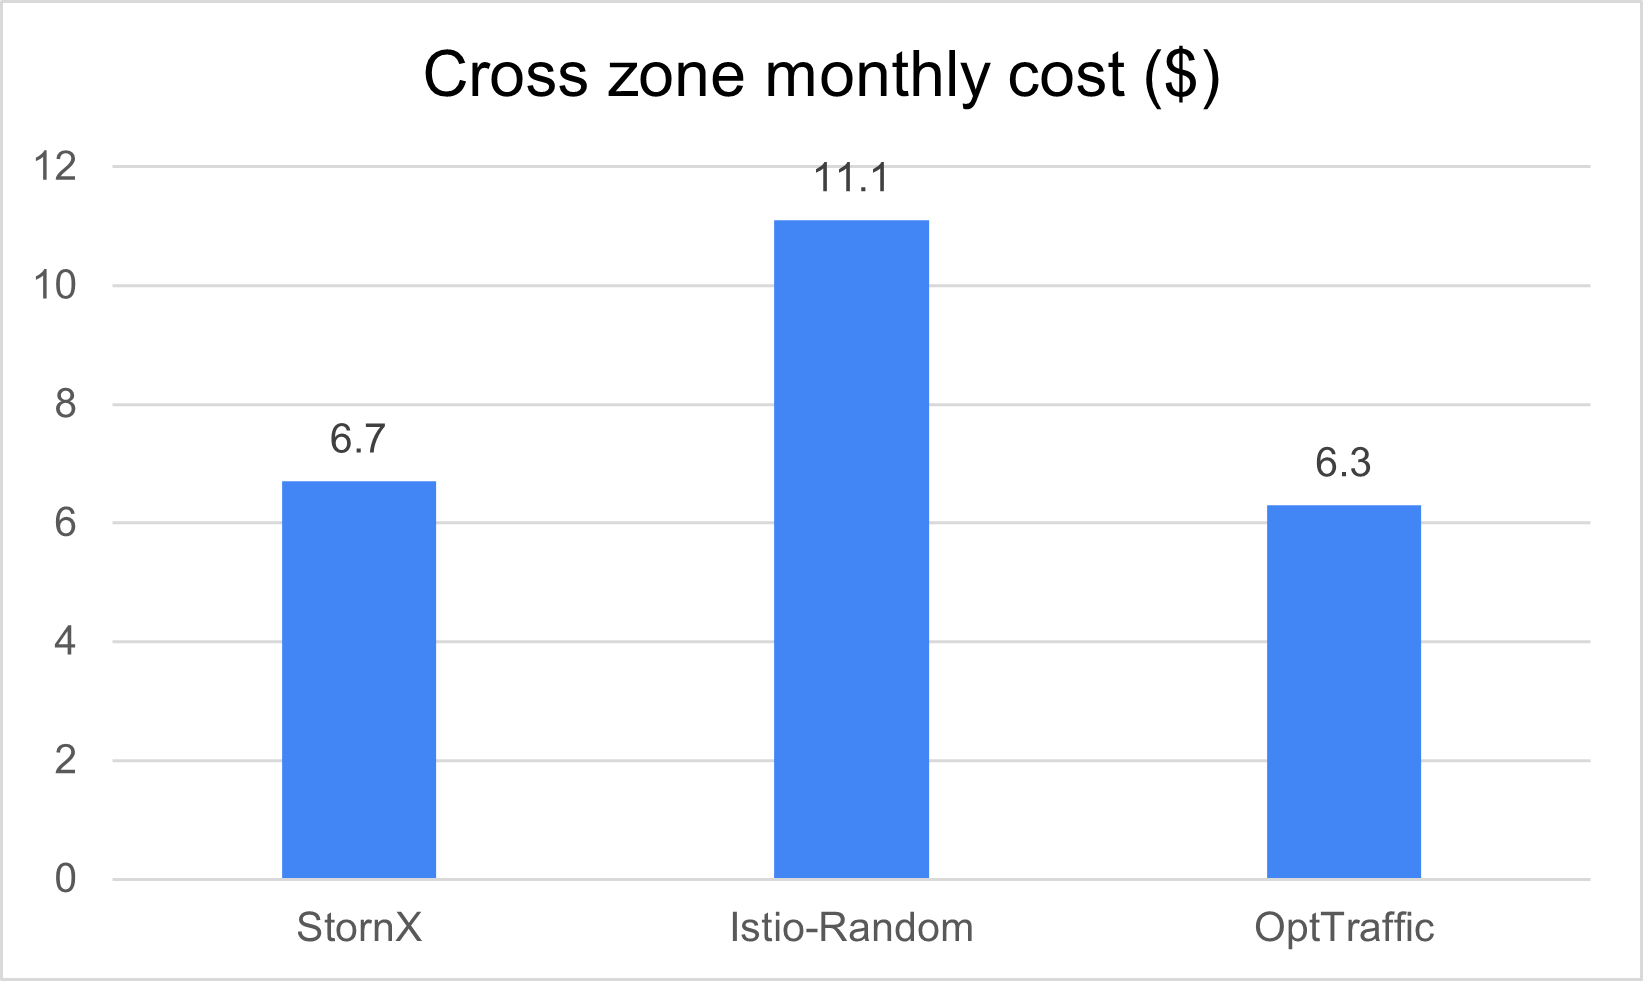
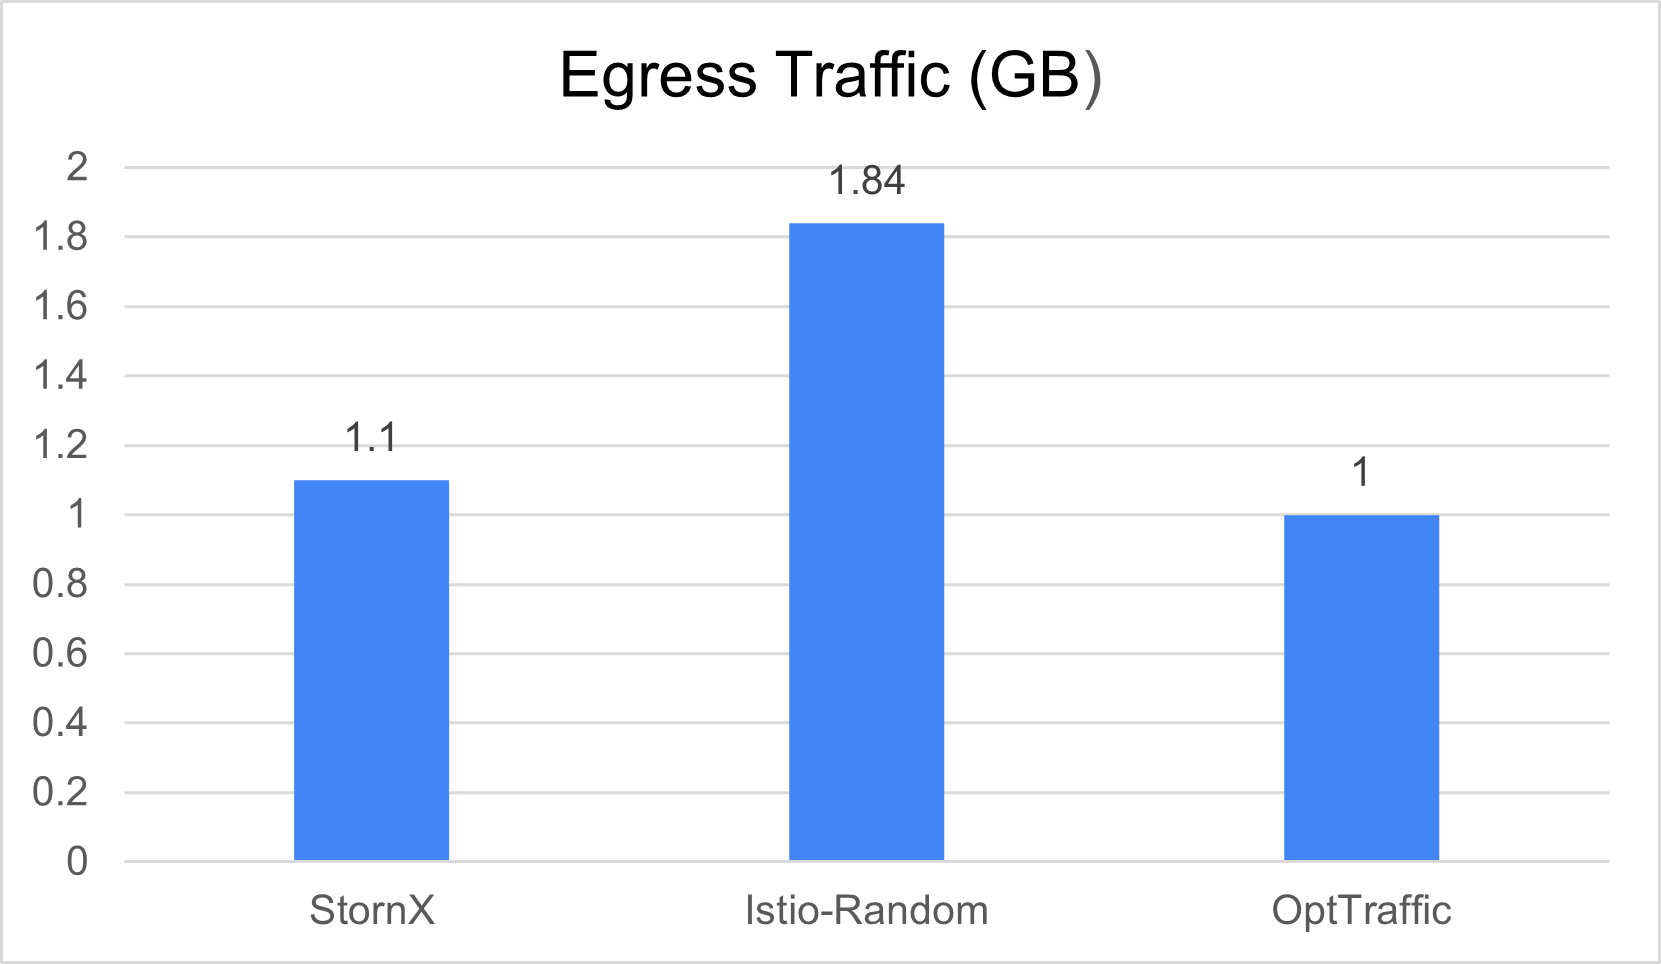
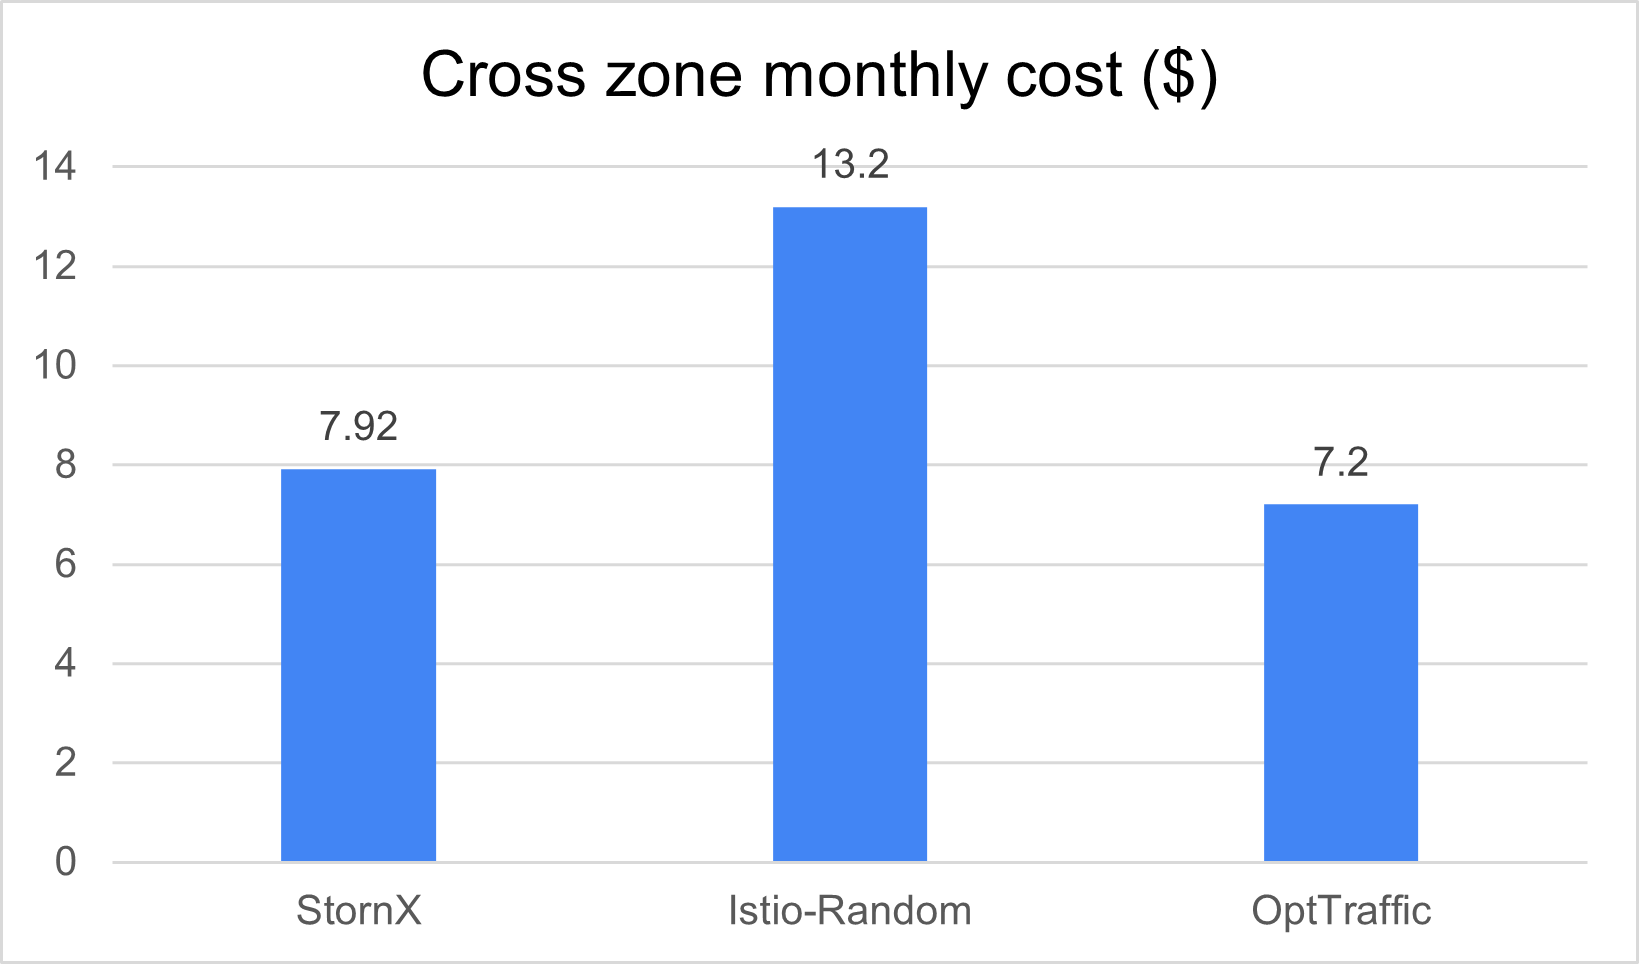
The cost picture (cross-AZ egress bytes) drops in proportion to the locality improvement:
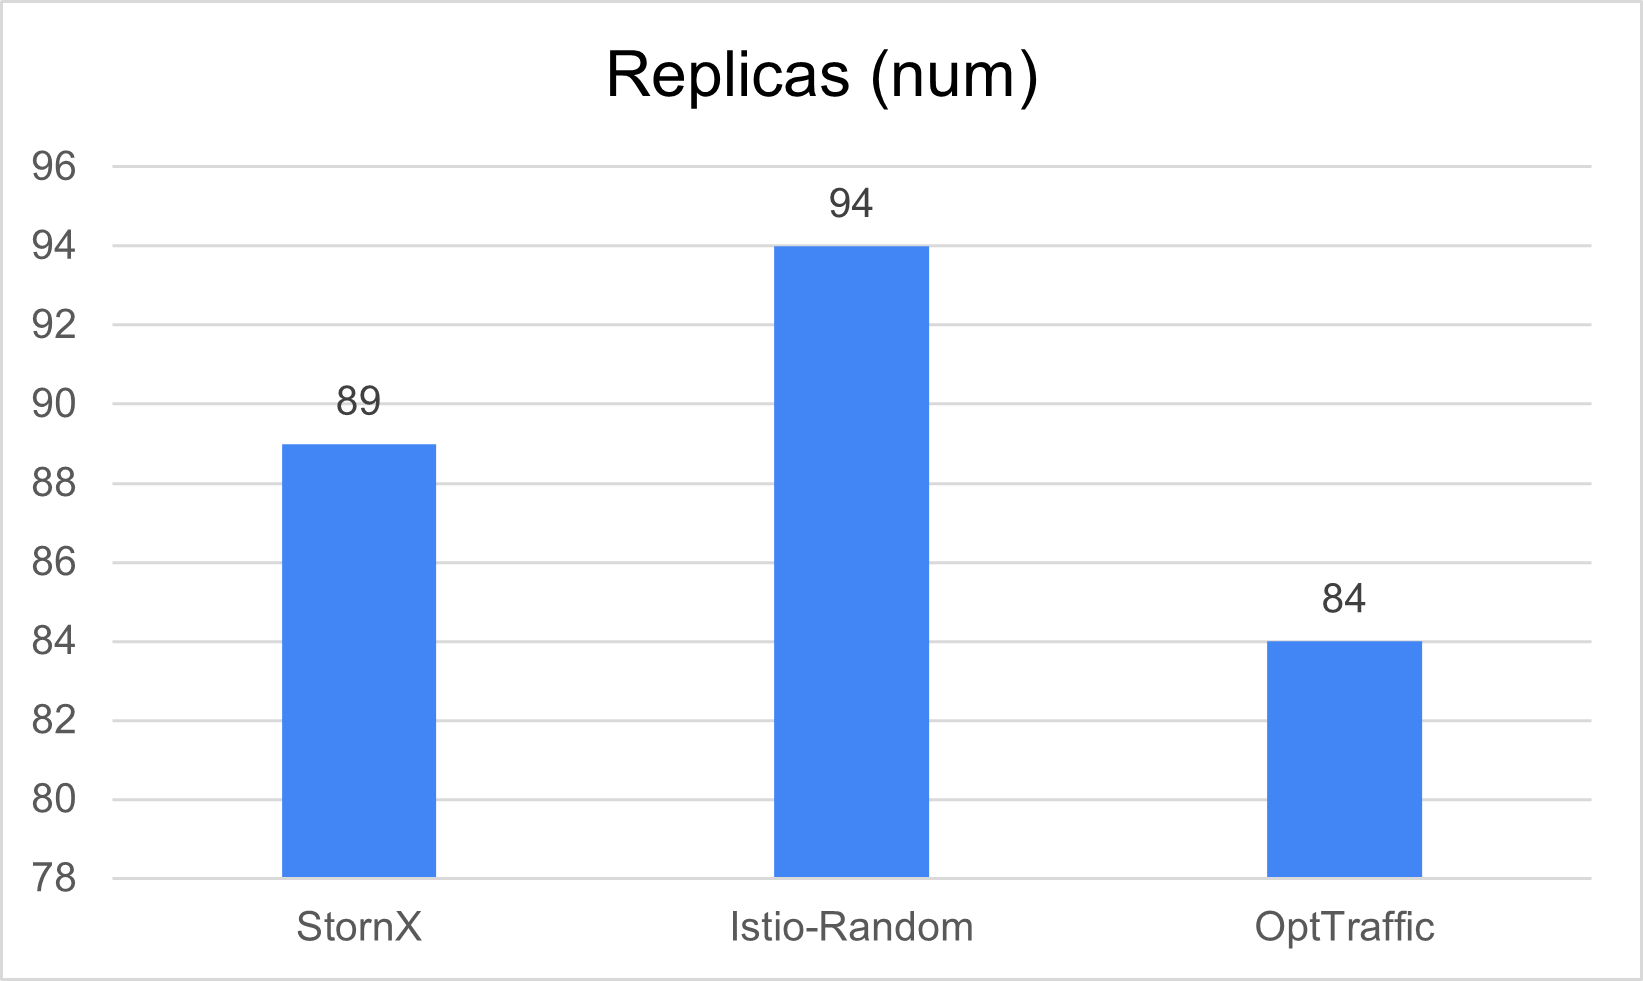
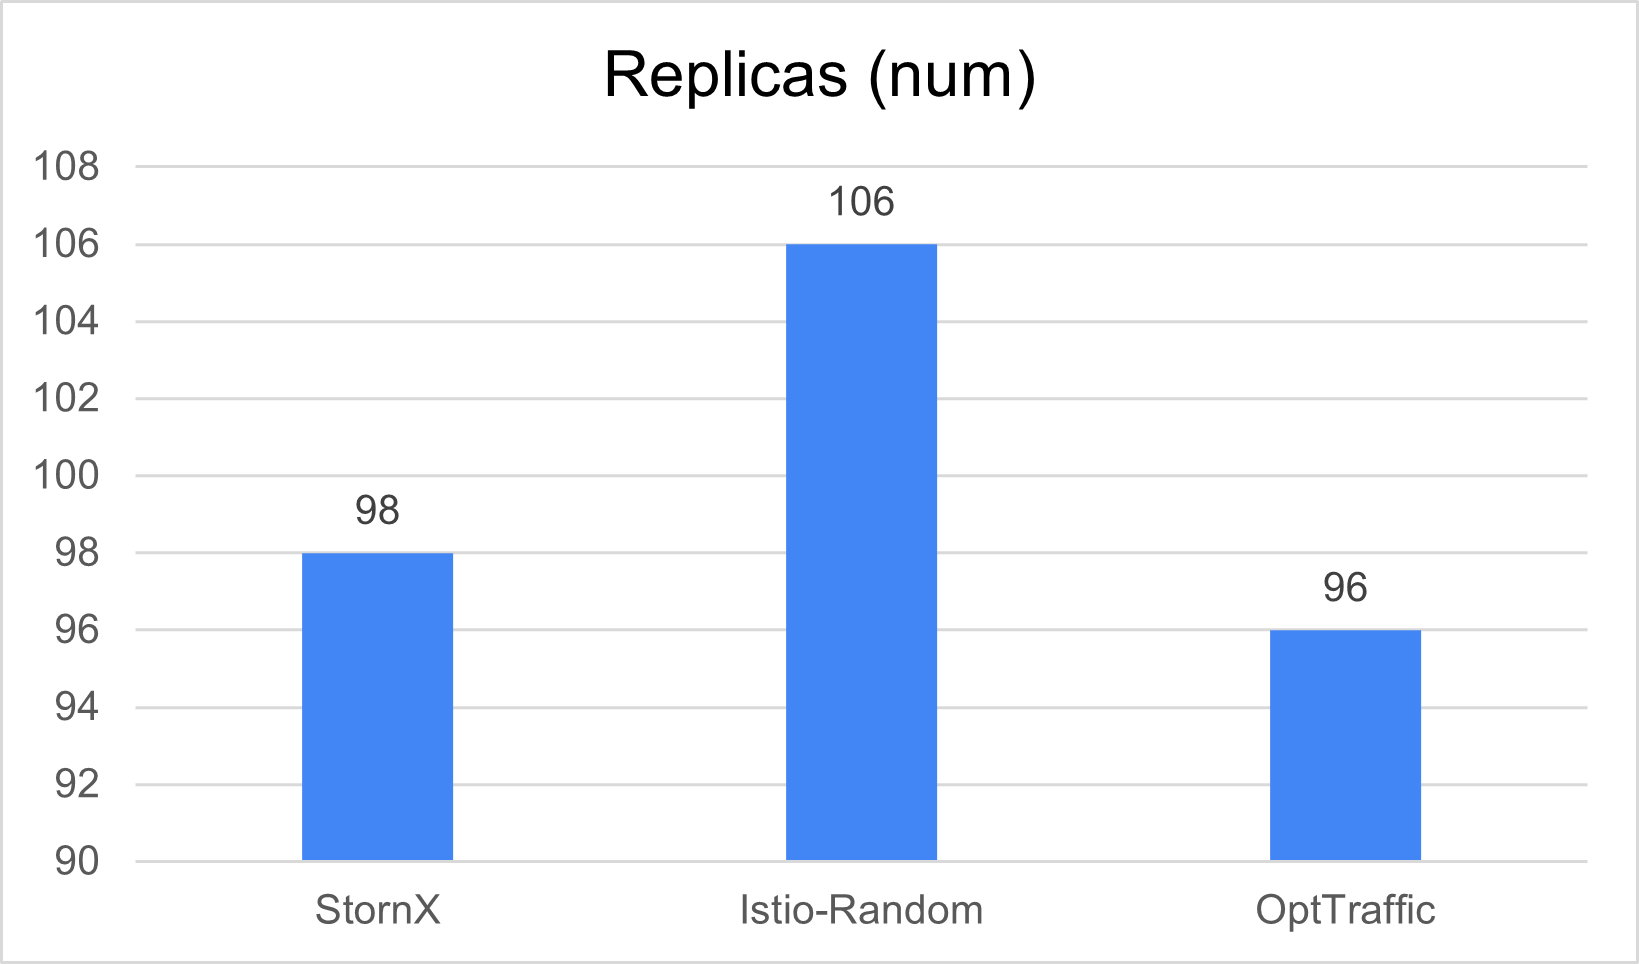
StornX achieves this without inflating the replica count - in fact, it keeps the cluster steadier:
OpenTelemetry Demo under load
The OpenTelemetry Demo has a denser service graph, so the locality optimization has more to chew on.
Latency:
Cost / egress:
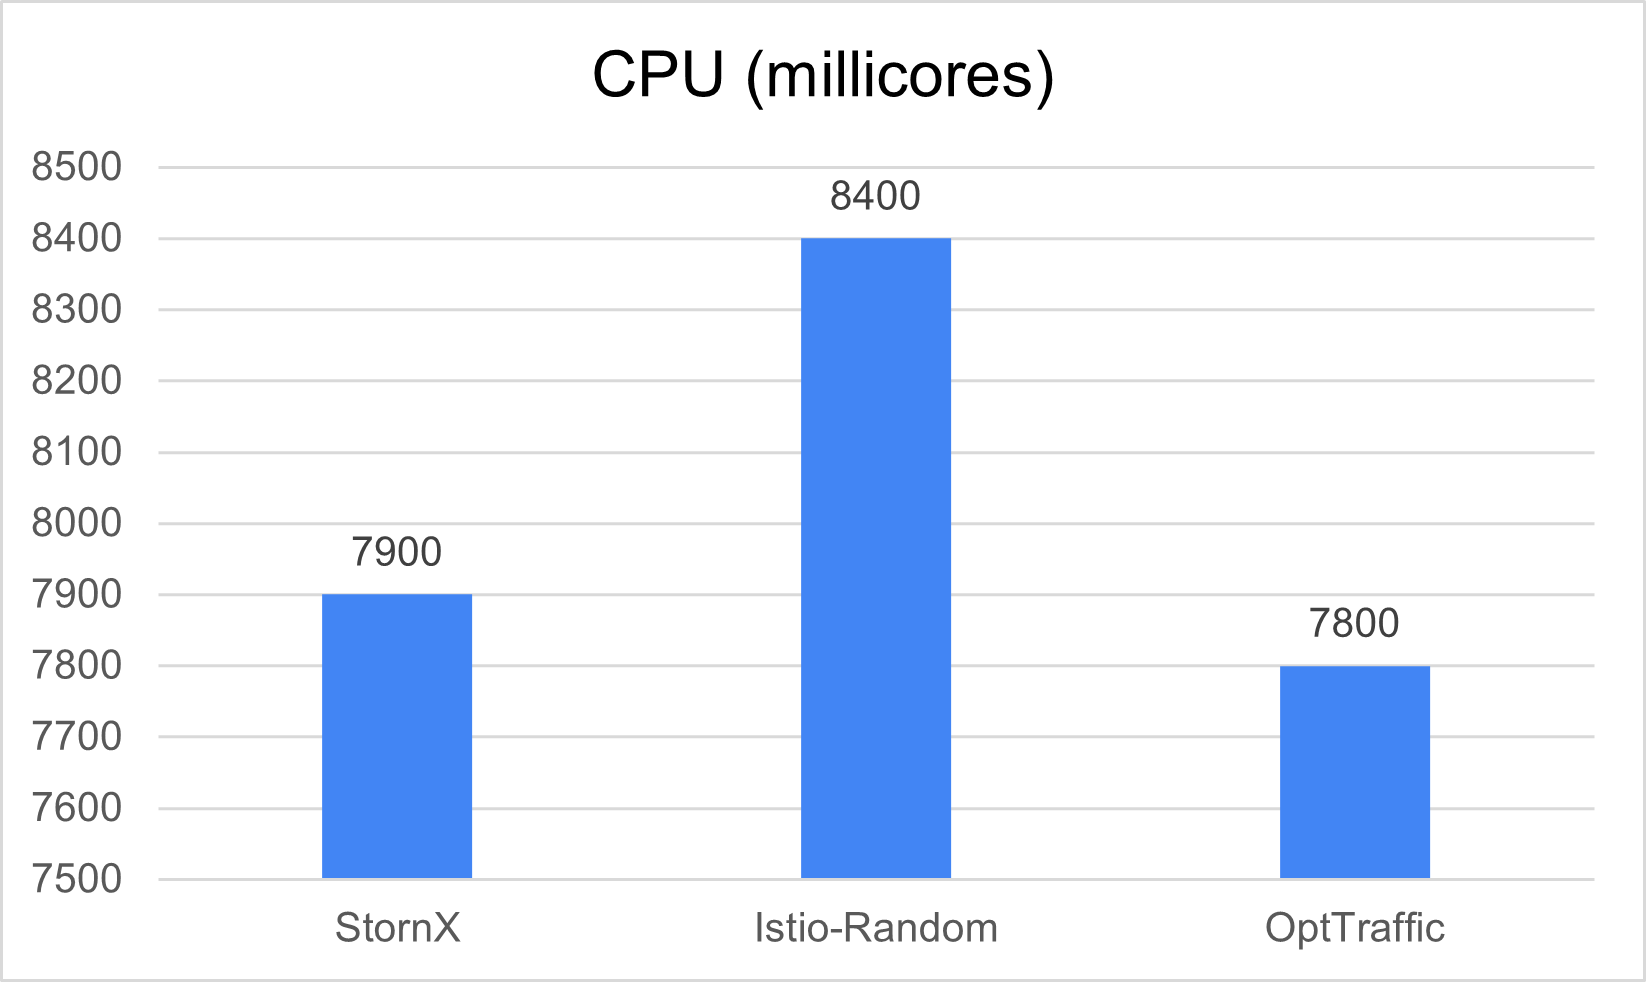
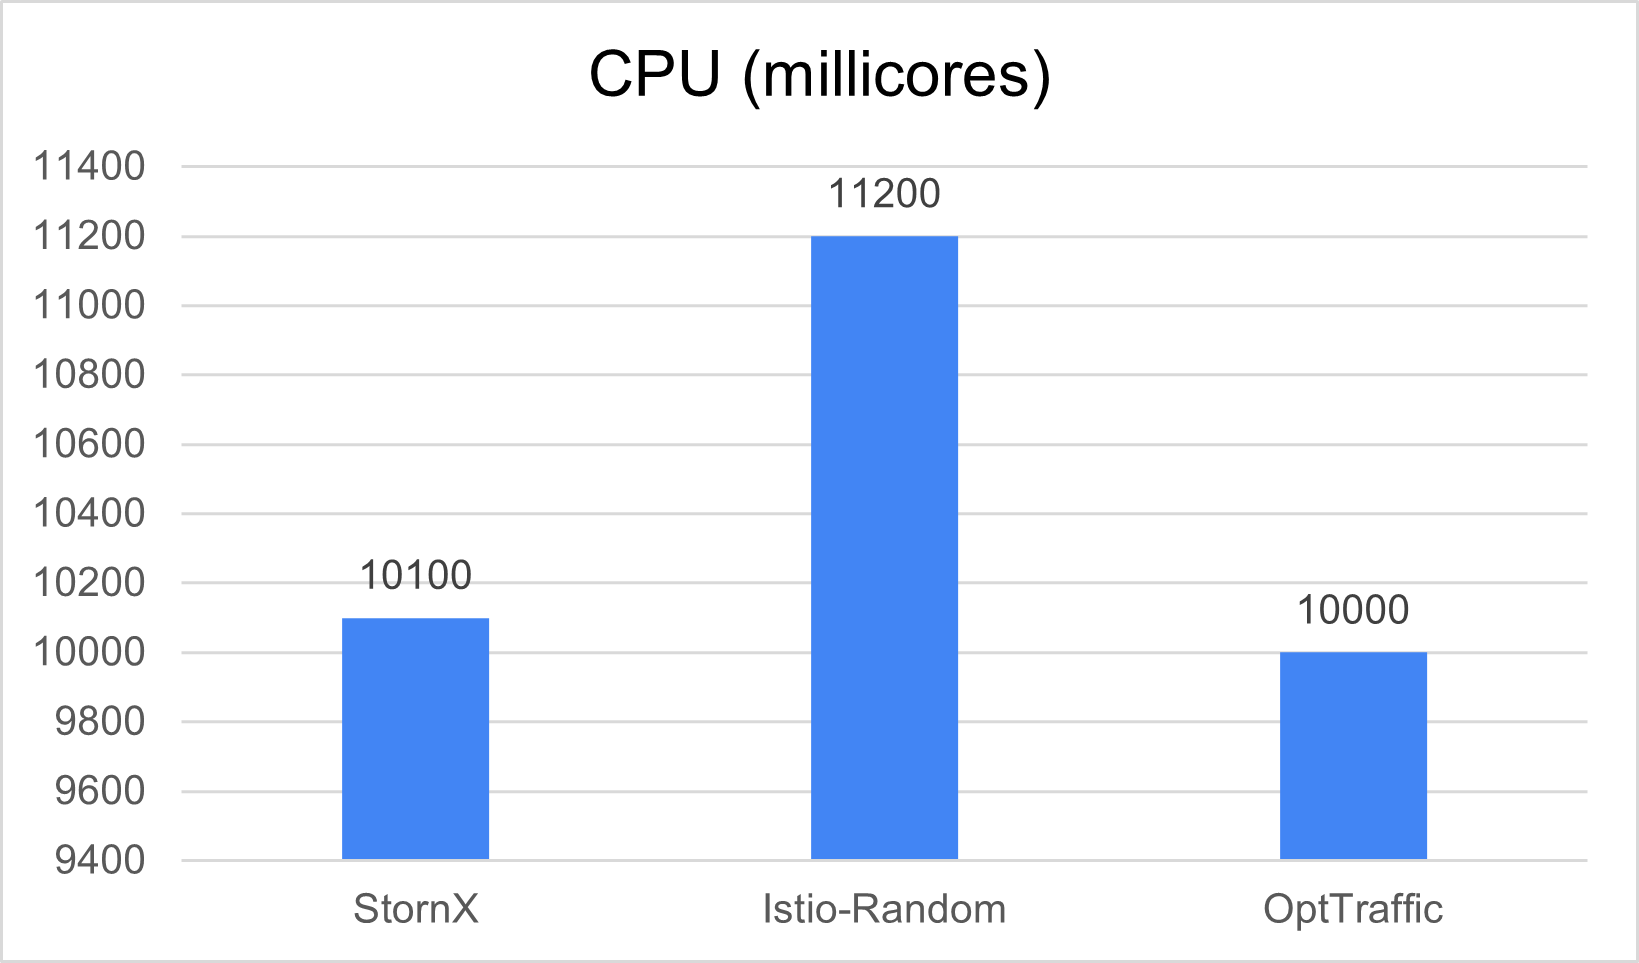
Replicas + CPU:
How to read these plots
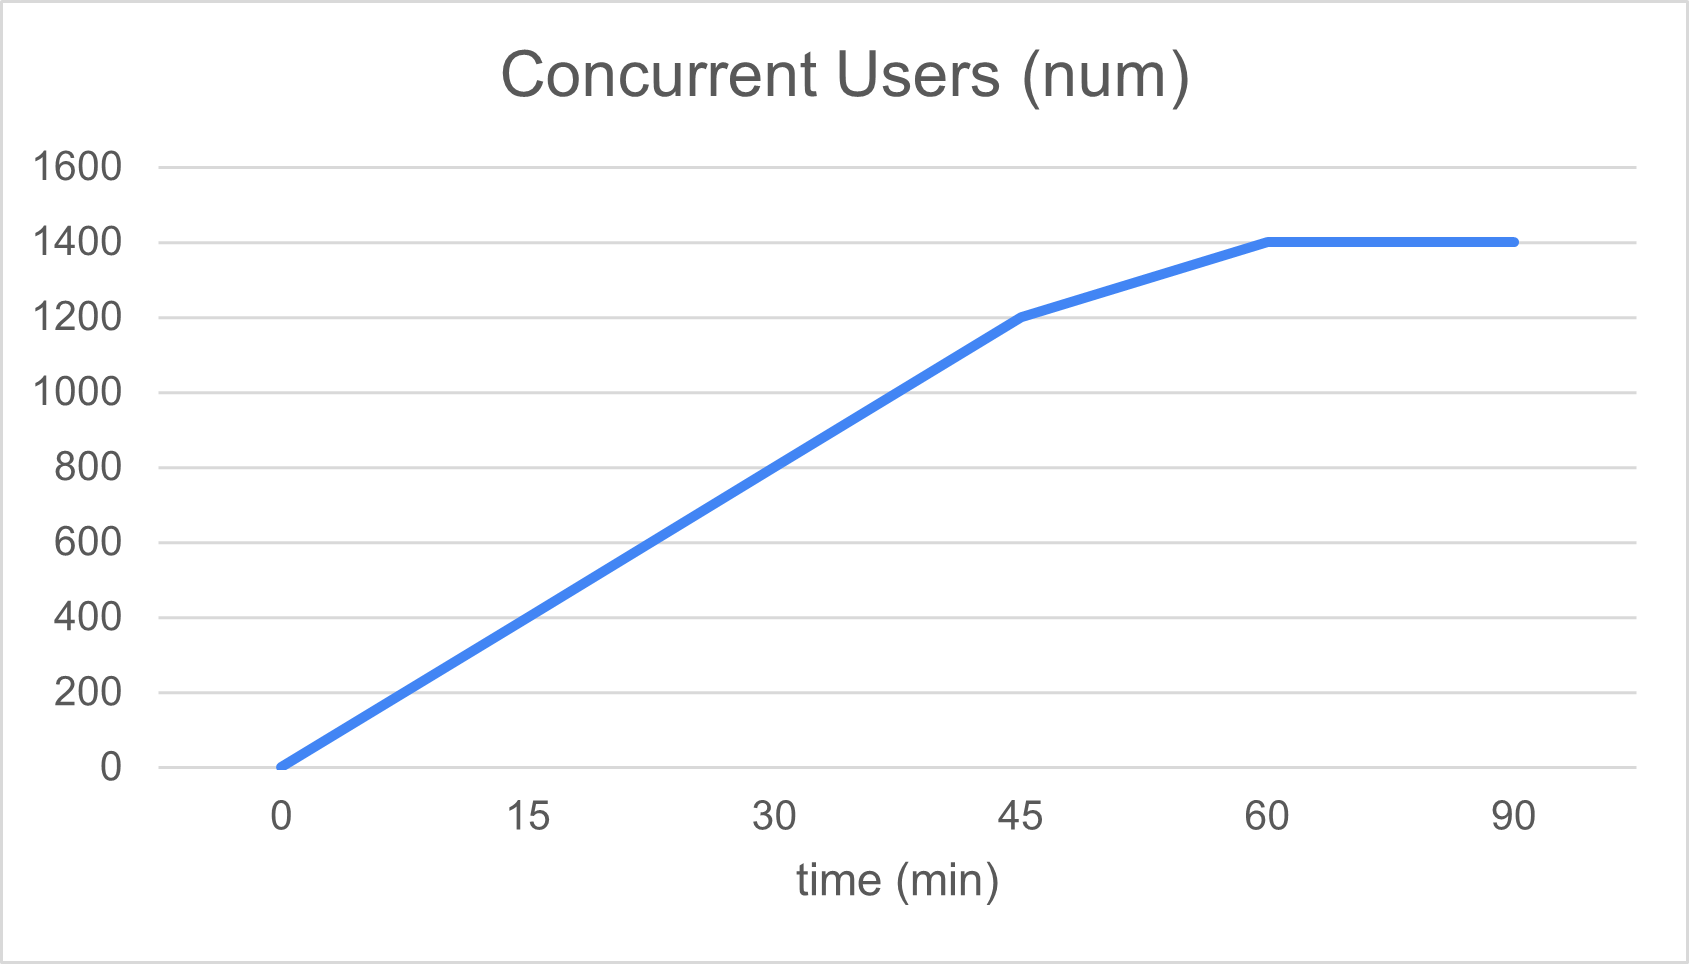
- Lower latency at the same replica count is the strongest evidence that StornX's placement is doing useful work - the application is the same, the load is the same, only where the Pods live changed.
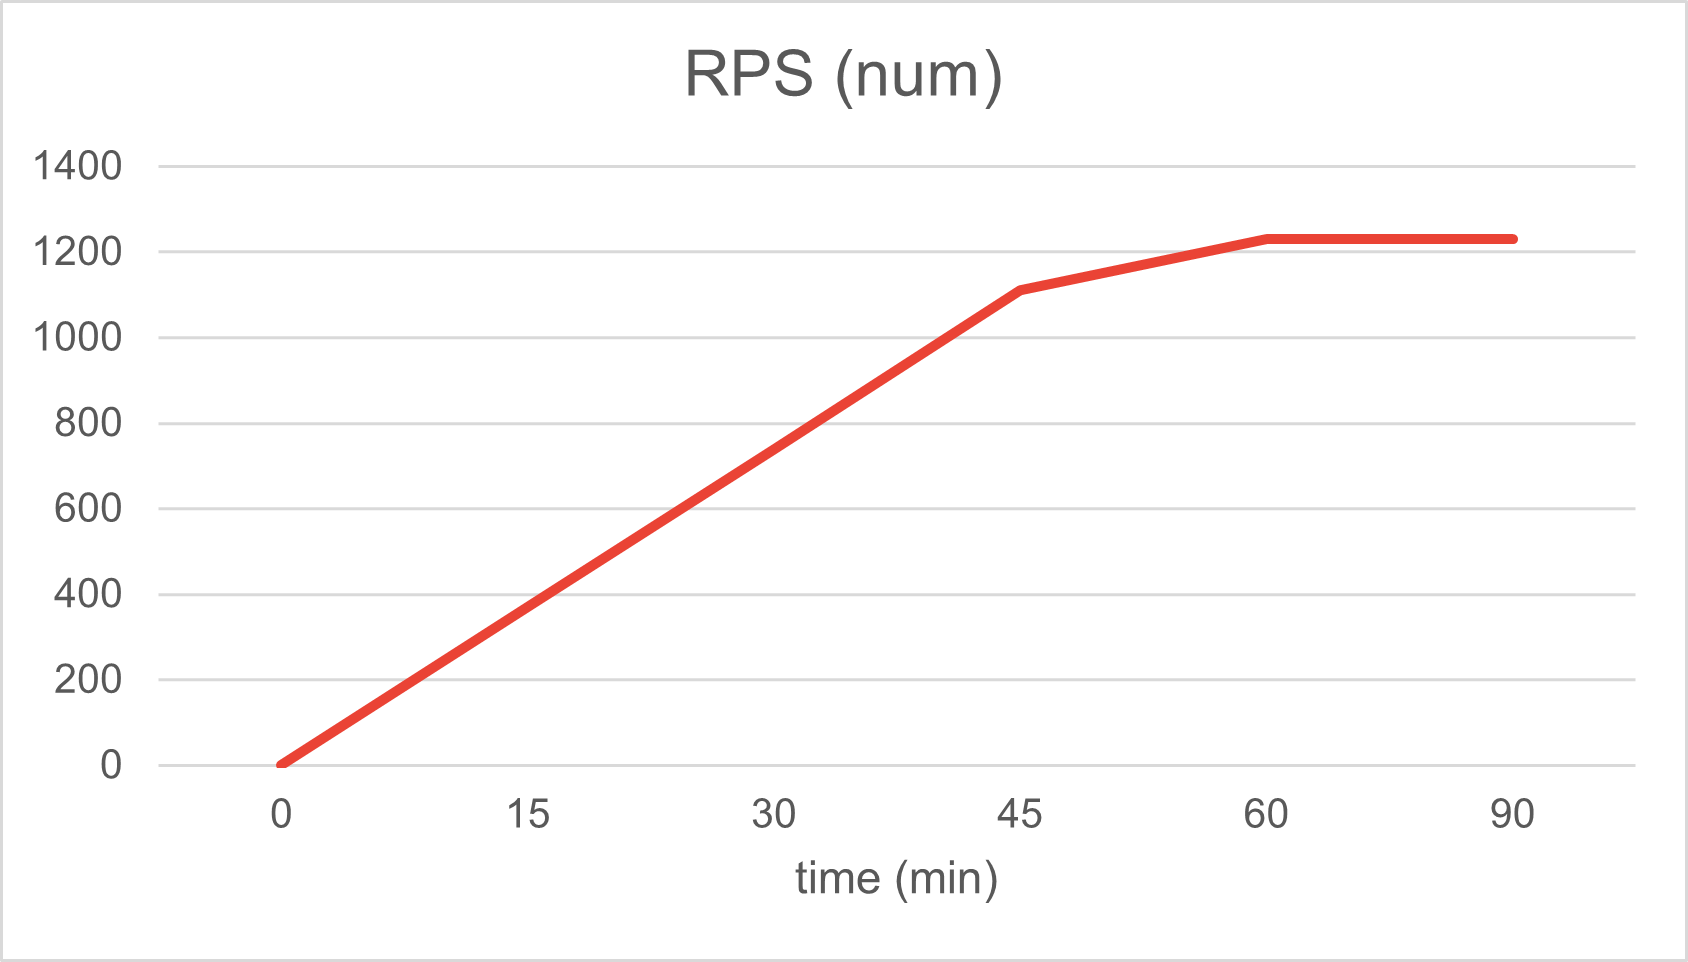
- Lower egress at the same throughput is the strongest evidence that locality preservation in OptiBalancer is doing useful work - the traffic was already there, it just stopped crossing AZ boundaries.
- Flatter replica curves mean less HPA thrash, which means less cold-start tax in your real applications.
Continue with Stress Tests to see how the controller behaves at the saturation limit, and Availability to see how it behaves during zone degradation.