Validation & Benchmarks
StornX was designed against real production patterns and validated with end-to-end load and stress tests on representative microservice applications. This section summarises the methodology and the headline findings - the goal is to give you confidence that the controller behaves the way the rest of this documentation claims, not to drown you in numbers.
If you want the raw data, every plot here is reproducible from the workload, dashboards and Helm values shipped in
perf-tests/.
What was tested
Two reference microservice applications, chosen because they represent the two most common shapes of real workloads:
| Application | Why |
|---|---|
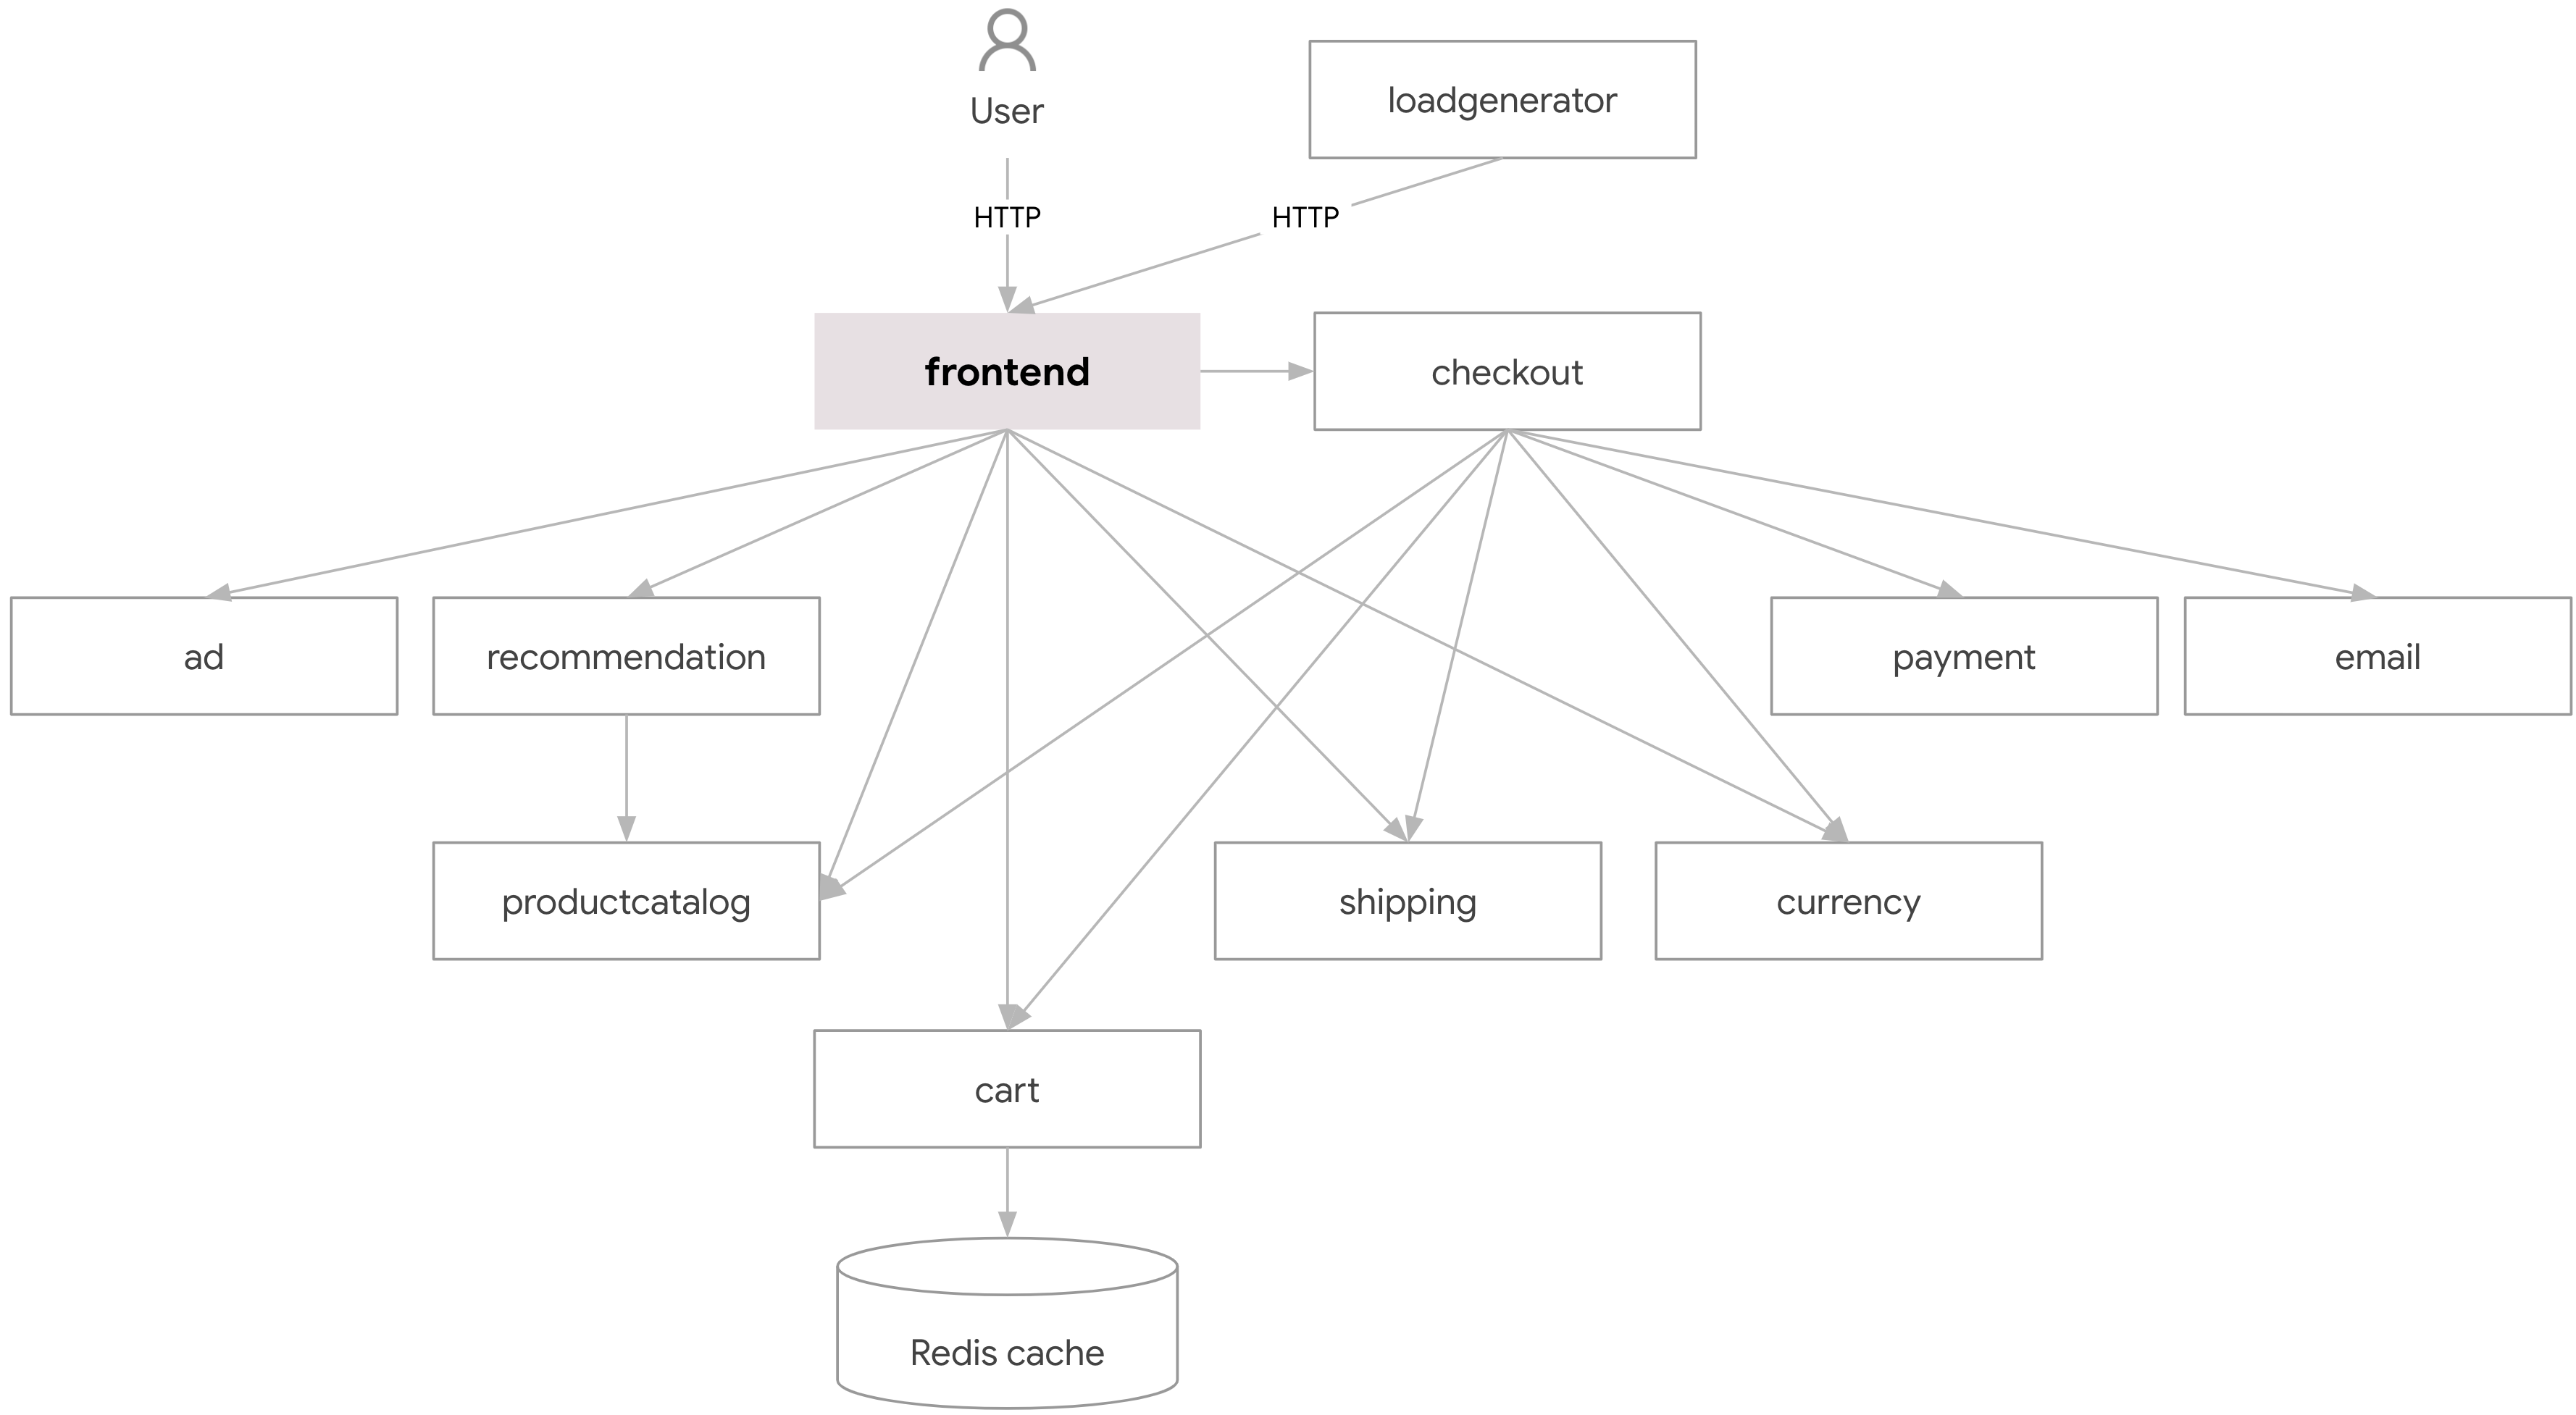
| Google Online Boutique | 10 services, classic e-commerce graph, light-to-moderate inter-service chatter. |
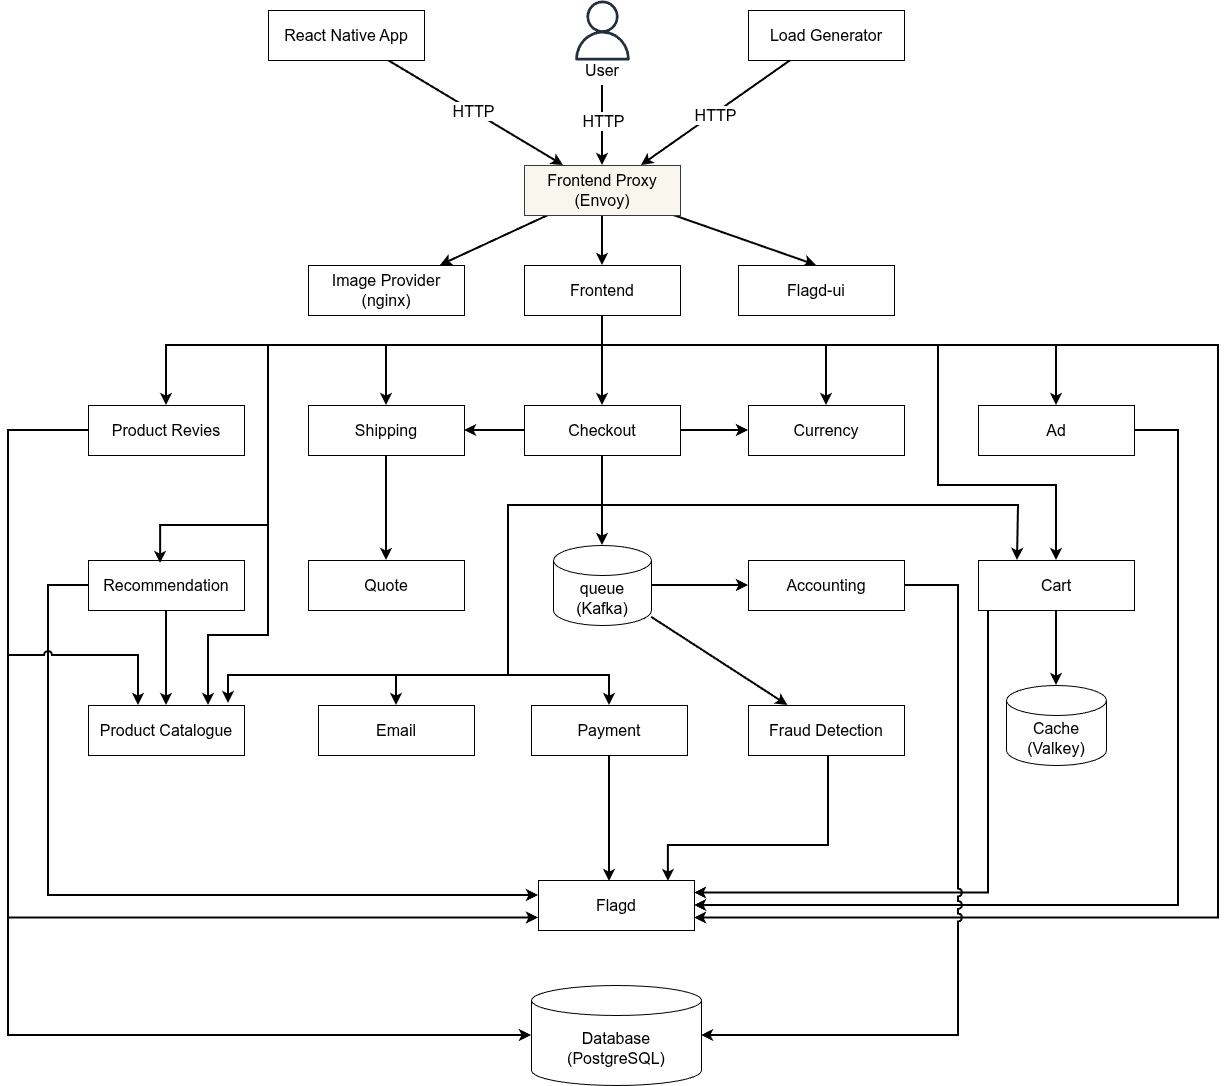
| OpenTelemetry Demo | 20+ services, heavier graph, mixed sync/async traffic, native observability. |
Where the tests ran
A production-like multi-AZ EKS cluster.
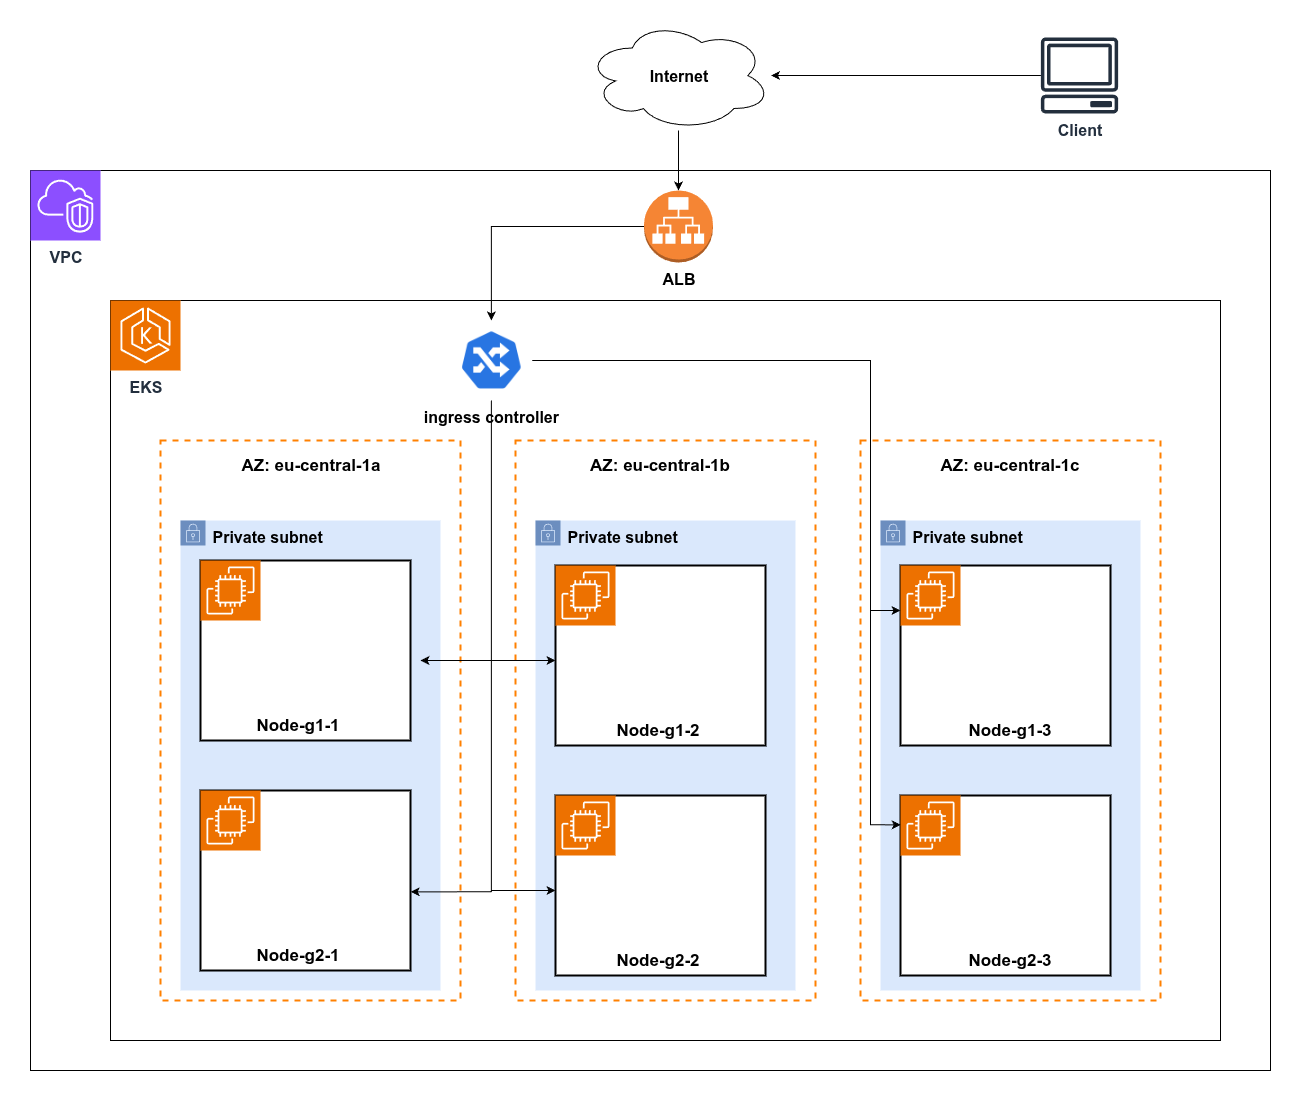
- AWS EKS (
eu-central-1), Kubernetes 1.33 - 3 availability zones, mix of
m5.large/m5.xlargeworker nodes - Istio 1.24.x with the addon Prometheus / Grafana / Kiali stack
- Kube-NetLag DaemonSet for node-to-node latency
- Load generated with k6 (rich scenarios in
perf-tests/k6/)
What was compared
Three configurations of the same cluster, all other variables held constant:
| Configuration | Autoscaling | Placement | Traffic routing |
|---|---|---|---|
| Baseline | Kubernetes HPA (CPU) | Default scheduler | Istio random load-balancing |
| OptTraffic | Kubernetes HPA (CPU) | Default scheduler | Istio locality routing only |
| StornX | OptiScaler | OptiScaler placement | OptiBalancer adaptive weights |
The goal is not to declare a single winner on a single metric, but to show how StornX shifts the cost / latency / availability frontier.
What was measured
| Dimension | Metric | Why it matters |
|---|---|---|
| Latency | End-to-end P95 response time per request | User experience |
| Throughput | Successful RPS sustained at the target load | Application capacity |
| Cost | Cross-AZ data-transfer bytes, replica-hours | Cloud bill |
| Reliability | Error rate during chaos (zone degradation, Pod kills) | Production-grade resilience |
| Resources | CPU and memory utilisation per replica | Right-sizing / waste |
Headline takeaways
The detailed plots are split across the next pages. The pattern is consistent:
- Lower P95 under load - StornX trades a small amount of fault-tolerance "spread" for substantial co-location wins once the minimum zone count is satisfied.
- Lower cost - fewer cross-AZ bytes; in load tests, also fewer replica-hours because OptiBalancer keeps the existing replicas working at a steady utilisation instead of forcing the HPA to over-scale.
- Better availability during simulated zone degradation - traffic shifts gradually toward healthy zones, errors stay near zero where the baseline produces visible error spikes.
Continue with:
- Load tests - sustained, realistic traffic
- Stress tests - saturating each service in turn
- Availability tests - simulated zone failures
- Side-by-side comparison - the summary table teams usually want